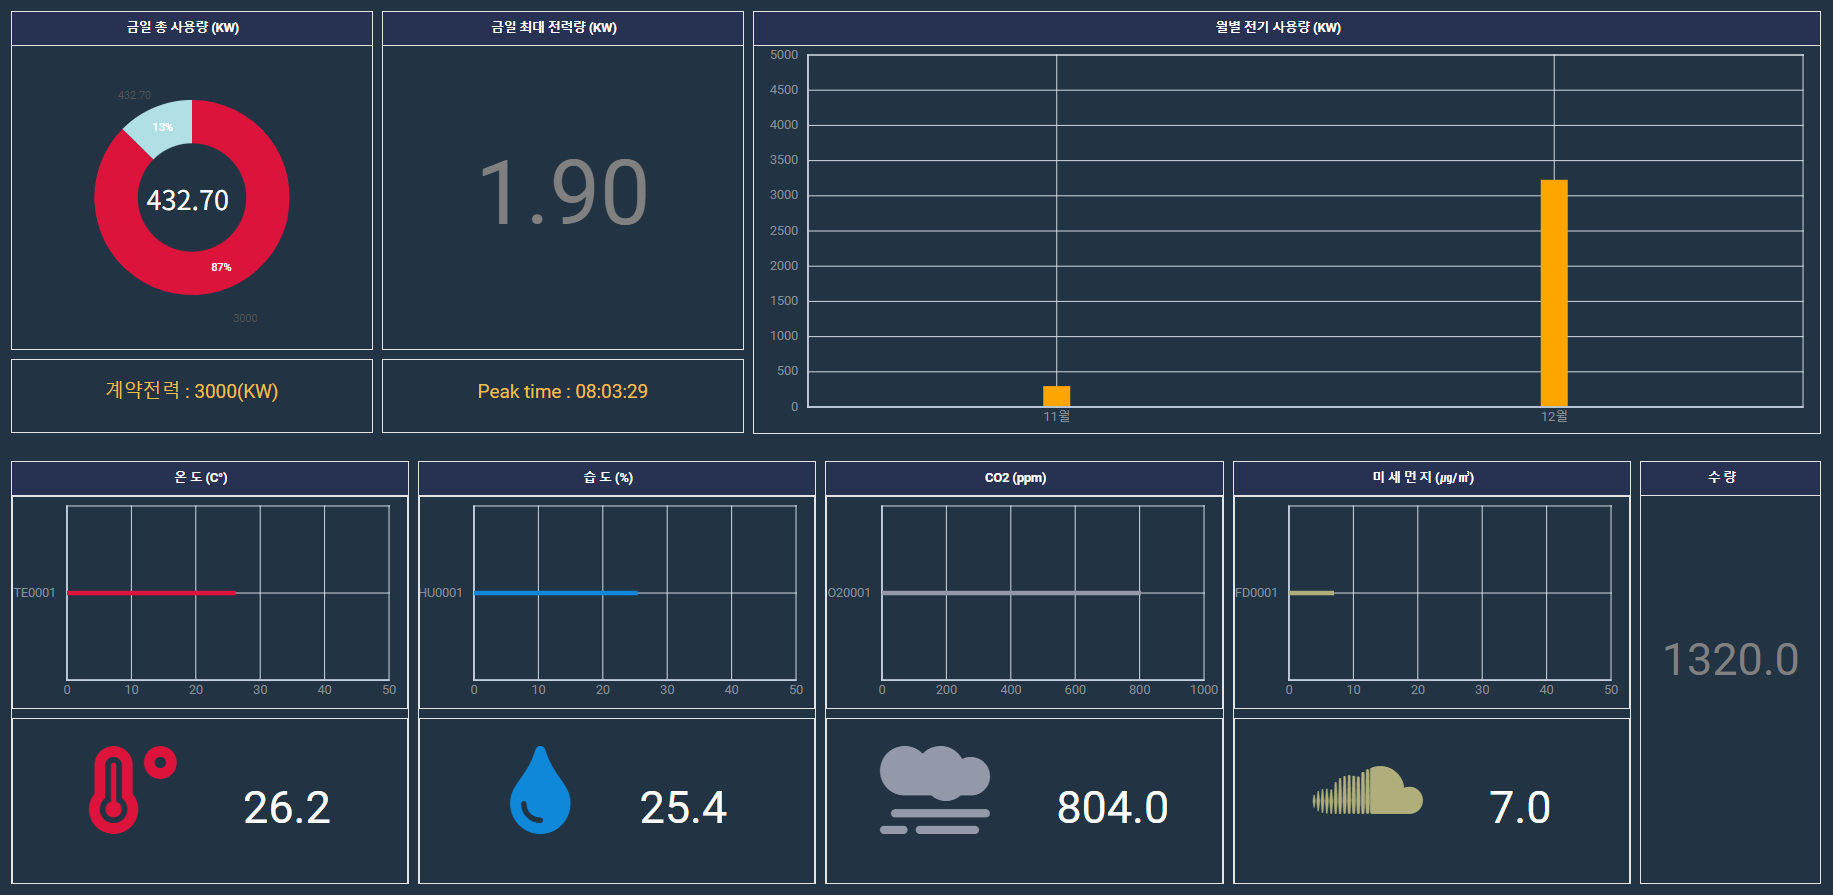
/*
##### 수정로그 #####
2021.12.14 김현중 신규
*/
//**************************************** GLOBAL ********************************************//
// widget
var layout;
var graph_obj = function(){
this.temp_graph; // temperature
this.humi_graph; // humidity
this.elec_graph; // electronic
this.co2_graph; // carbon dioxide
this.aero_graph; // aerosol (air polution)
this.cnt_graph; // count
this.elec_donut; // electronic_donut
};
var graph_box = new graph_obj();
// data
var data_obj = function(){
this.temp_dat; // temperature
this.humi_data; // humidity
this.elec_data; // electronic
this.co2_data; // carbon dioxide
this.aero_data; // aerosol (air polution)
this.cnt_data; // count
}
//*************************************** EXECUTION ******************************************//
$(function(){
//<<<<<<<<<<<< CREATE WIDGET >>>>>>>>>>>>>>
//layout
layout = create_layout();
//graph
/****ELECTRONIC****/
graph_box.elec_donut = create_record_donut();
layout.getCell('elec_total').attach(graph_box.elec_donut);
graph_box.elec_donut.data.parse([{'name':'nth', 'value':3000, 'color':'crimson'}]);//default
setTimeout(() => {//donut css
$('circle').attr('fill','#223343');
$('circle').attr('r','70');
var circle_idx = $('circle').offset();
$('#total_center').offset({ left: circle_idx.left+20, top: circle_idx.top+50});
},100);
graph_box.elec_graph = create_vertical(10, 5000, 0);
layout.getCell('elec_graph').attach(graph_box.elec_graph);
select_monthly()
.then((json) =>{
graph_box.elec_graph.data.parse(json.data); //monthly
$('#peak_value').text(json.sub_data[0].max_regtime); //peak
graph_box.elec_donut.data.parse([{'name':'max', 'value':3000, 'color':'crimson'}, {'name':'now', 'value':json.sub_data[0].sum_value, 'color':'powderblue'}]); //total
$('#total_center').text(json.sub_data[0].sum_value);
layout.getCell('elec_max').attachHTML(json.sub_data[0].max_value); //max
});
/****temperature****/
graph_box.temp_graph = create_horizontal(50, 0, 'crimson');
layout.getCell('temp_graph').attach(graph_box.temp_graph);
select_sensors('TE')
.then((json) =>{
graph_box.temp_graph.data.parse(json.data);
$('#temp_num').children().text(json.data[0].value);
});
setInterval(function(){
select_sensors('TE')
.then((json) =>{
graph_box.temp_graph.data.parse(json.data);
$('#temp_num').children().text(json.data[0].value);
});
}, 5000);
/****humidity****/
graph_box.humi_graph = create_horizontal(50, 0, '#0f88da');
layout.getCell('humi_graph').attach(graph_box.humi_graph);
select_sensors('HU')
.then((json) =>{
graph_box.humi_graph.data.parse(json.data);
$('#humi_num').children().text(json.data[0].value);
});
setInterval(function(){
select_sensors('HU')
.then((json) =>{
graph_box.humi_graph.data.parse(json.data);
$('#humi_num').children().text(json.data[0].value);
});
}, 5000);
/****co2****/
graph_box.co2_graph = create_horizontal(1000, 0, '#9399a9');
layout.getCell('co2_graph').attach(graph_box.co2_graph);
select_sensors('CO2')
.then((json) =>{
graph_box.co2_graph.data.parse(json.data);
$('#co2_num').children().text(json.data[0].value);
});
setInterval(function(){
select_sensors('CO2')
.then((json) =>{
graph_box.co2_graph.data.parse(json.data);
$('#co2_num').children().text(json.data[0].value);
});
}, 5000);
/****aero****/
graph_box.aero_graph = create_horizontal(50, 0, '#b0af7c');
layout.getCell('aero_graph').attach(graph_box.aero_graph);
select_sensors('FD')
.then((json) =>{
graph_box.aero_graph.data.parse(json.data);
$('#aero_num').children().text(json.data[0].value);
});
setInterval(function(){
select_sensors('FD')
.then((json) =>{
graph_box.aero_graph.data.parse(json.data);
$('#aero_num').children().text(json.data[0].value);
});
}, 5000);
/****count****/
select_sensors('CNT')
.then((json) =>{
layout.getCell('cnt_num').attachHTML(json.data[0].value);
});
setInterval(function(){
select_sensors('CNT')
.then((json) =>{
layout.getCell('cnt_num').attachHTML(json.data[0].value);
});
}, 5000);
});
//*************************************** CONFIG & LOGIC ******************************************//
//LAYOUT [Main]
function create_layout(){
return new dhx.Layout("layout", { //LAYOUT
rows: [
{
padding:'15px',
type: "wide",
cols: [
{
width: "20%",
rows: [
{
height:"80%",
header: "금일 총 사용량 (KW)",
id: "elec_total",
html: ``
},
{
height:"17.5%",
id: "elec_etc1",
html: "계약전력 : 3000(KW)"
},
]
},
{
width: "20%",
rows: [
{
height:"80%",
header: "금일 최대 전력량 (KW)",
id: "elec_max",
html: ``
},
{
height:"17.5%",
id: "elec_etc2",
html: `<span>Peak time : </span><span id = peak_value><\/span>`
},
]
},
{
width: "59%",
rows: [
{
header: "월별 전기 사용량 (KW)",
id: "elec_graph",
},
]
},
]
},
{
padding:'15px',
type: "wide",
cols: [
{
header: "온 도 (C°)",
width: "22%",
rows: [
{
height:"55%",
id: "temp_graph",
},
{
height:"45%",
id: "temp_number",
html: `<span id = 'temp_icon'>
<i class="fas fa-temperature-high fa-7x"></i>
<\/span>
<span id = 'temp_num'>
<span class = "number">0</span>
<\/span>`
},
]
},
{
header: "습 도 (%)",
width: "22%",
rows: [
{
height:"55%",
id: "humi_graph",
},
{
height:"45%",
id: "humi_number",
html: `<span id = 'humi_icon'>
<i class="fas fa-tint fa-7x"></i>
<\/span>
<span id = 'humi_num'>
<span class = "number" >0</span>
<\/span>`
},
]
},
{
header: "CO2 (ppm)",
width: "22%",
rows: [
{
height:"55%",
id: "co2_graph",
},
{
height:"45%",
id: "co2_number",
html: `<span id = 'co2_icon'>
<i class="fas fa-smog fa-7x"></i>
<\/span>
<span id = 'co2_num'>
<span class = "number" >0</span>
<\/span>`
},
]
},
{
header: "미 세 먼 지 (㎍/㎥)",
width: "22%",
rows: [
{
height:"55%",
id: "aero_graph",
},
{
height:"45%",
id: "aero_number",
html: `<span id = 'aero_icon'>
<i class="fab fa-soundcloud fa-7x"></i>
<\/span>
<span id = 'aero_num'>
<span class = "number" >0</span>
<\/span>`
},
]
},
{
width: "10%",
rows: [
{
header: "수 량",
id: "cnt_num",
html: ``
}
]
},
]
},
]
});
}
//GRAPH [y-bar]
function create_vertical(_tick, _max, _min){
return new dhx.Chart("", {
type: "bar",
scales: {
bottom: {
text: "month"
},
left: {
maxTicks: _tick,
max: _max,
min: _min
}
},
series: [
{
value: "monthly_data",
color: "none",
size: 35,
fill: "orange",
}
]
});
}
//GRAPH [x-bar]
function create_horizontal(_max, _min, _fill){
return new dhx.Chart("", {
type: "xbar",
css:"small-x",
barWidth:5,
scales: {
bottom: {
maxTicks: 5,
max: _max,
min: _min,
},
left: {
text: "code"
}
},
series: [
{
value: "value",
color: "none",
size: 35,
fill: _fill,
}
]
});
}
//donut graph [elec_total]
function create_record_donut(){
return new dhx.Chart("",
{
type: "donut",
series: [
{
value: "value",
color: "color",
}
]
}
);
}
//*************************************** FUNCTION [QUERY] ******************************************//
//ELEC data [select]
function select_monthly(){
return new Promise((resolve, reject) =>{
call_ajax('select_monthly',{'data' : ''},function(json){
if(json.result == 'success'){
resolve(json);
}
}, true);
});
}
//ETC data [select]
function select_sensors(code){
return new Promise((resolve, reject) =>{
call_ajax('select_sensors',{'data' : {'code' : code} },function(json){
if(json.result == 'success'){
resolve(json);
}
}, true);
});
}
